
FOURKITES: DESIGNING FOR UNCERTAINTY
Designing for trust when real-time data is uncertain, incomplete, or conflicting, so people could stake high-value calls on it
FourKites sells supply-chain visibility: software telling shippers where their freight is and when it will land, so they can staff docks, hold production lines, and make promises to their own customers. The product is worth exactly what its data is trusted to be.
38%
Customer retention, year over year
6–12hr
Earlier Predictions
30+
Fortune 500 enterprises on the platform
Dashboards people staked million-dollar calls on, built over a period when retention rose 38% YoY.
The Strategic Problem
FourKites' core product promise was real-time visibility that customers could trust, but real-world supply chain data is messy: duplicate sources, stale GPS pings, conflicting carrier feeds, and ETAs that shift every hour.
Anyone can show a truck on a map. The design problem was a visibility experience customers trust enough to bet a contract on.
That distrust was earned. Freight had heard twenty years of over-promised “real-time visibility,” and reefer loads (refrigerated trailers, notorious for false alerts) had trained everyone that an alert probably meant nothing. Winning a show-me industry meant pulling every signal onto one pane of glass, not just phones, and always showing how sure the data was.
Why This Was Hard
Trust in data products is fragile. One bad prediction can undo months of credibility:
- Data quality: 10M+ daily tracking events from trucks, trains, ships, and planes, often uncertain, incomplete, or conflicting
- Technical reality: GPS signals drop, carriers report late, ETAs shift constantly
- User stakes: Fortune 500 logistics managers making high-stakes calls based on this data
- Competitive pressure: Needed to differentiate on trust, not just features
- Hypergrowth context: Building while the company scaled from $3M to $100M in annual recurring revenue
Hiding uncertainty would have been easier. But it would have destroyed trust the moment predictions failed.
Why It Worked This Time
Real-time freight visibility had a graveyard behind it. The industry had chased it for years and it never quite held. Two things finally changed: nearly every driver now carried a phone with GPS, and carrier and telematics APIs were maturing into something you could actually build on. The judgment call wasn't inventing tracking. It was recognizing the enabling conditions had finally arrived, and designing for them before competitors did.
But the data still wasn't accurate for free. Each facility needed custom geo-fences to turn raw GPS pings into trustworthy "arrived / departed" events, and the predictive models were tuned by client domain experts feeding in their own operational experience: the dock supervisor who knows this yard backs up at 6am. We saw exactly how much hand-work accuracy took, location by location. That's precisely why hiding uncertainty was never on the table: we knew where the data was soft.
"Never hide uncertainty"
Strategy
We established "Never hide uncertainty" as the core design principle. This meant:
- Confidence as First-Class Data: Show data confidence alongside status. Users know when to trust and when to verify
- Progressive Disclosure: Surface reliable status at a glance; reveal sources, confidence intervals, and alternatives on demand
- Predictive, Not Reactive: Predict problems 6–12 hours before they happen. Give users time to act, not just react
- Action-First Alerts: Every notification includes recommended actions, not just status updates
What We Ruled Out
Three easier paths, each a trap for a data product:
- Show one confident ETA: the clean single number everyone wanted. It demos beautifully and dies the first time it's wrong; in freight, it's wrong constantly.
- Surface every source and confidence interval at once: honest, but it buries a logistics manager in noise. Trust comes from legible uncertainty, not maximal uncertainty.
- Alert on everything: maximizes "we caught it," guarantees alert fatigue, and trains users to ignore the one alert that mattered.
The discipline was subtraction: glanceable status first, confidence and sources on demand, alerts only when there's an action to take.
The bet. Showing uncertainty looks less impressive than a single confident number. In a demo, it looks like the weaker product. The wager was that trust compounds and false confidence collapses: the platform customers believe at 2am, when a load is late and the ETA keeps shifting, is the one that admitted what it didn't know.
Execution
Real-Time Control Tower
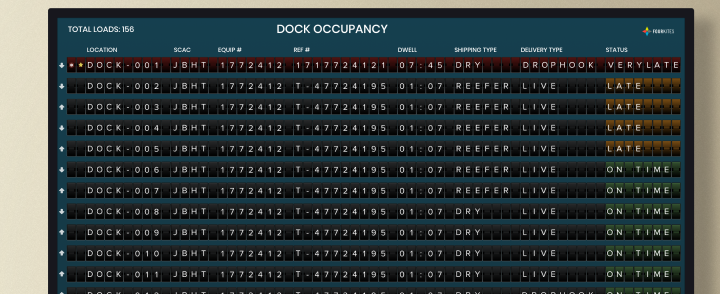
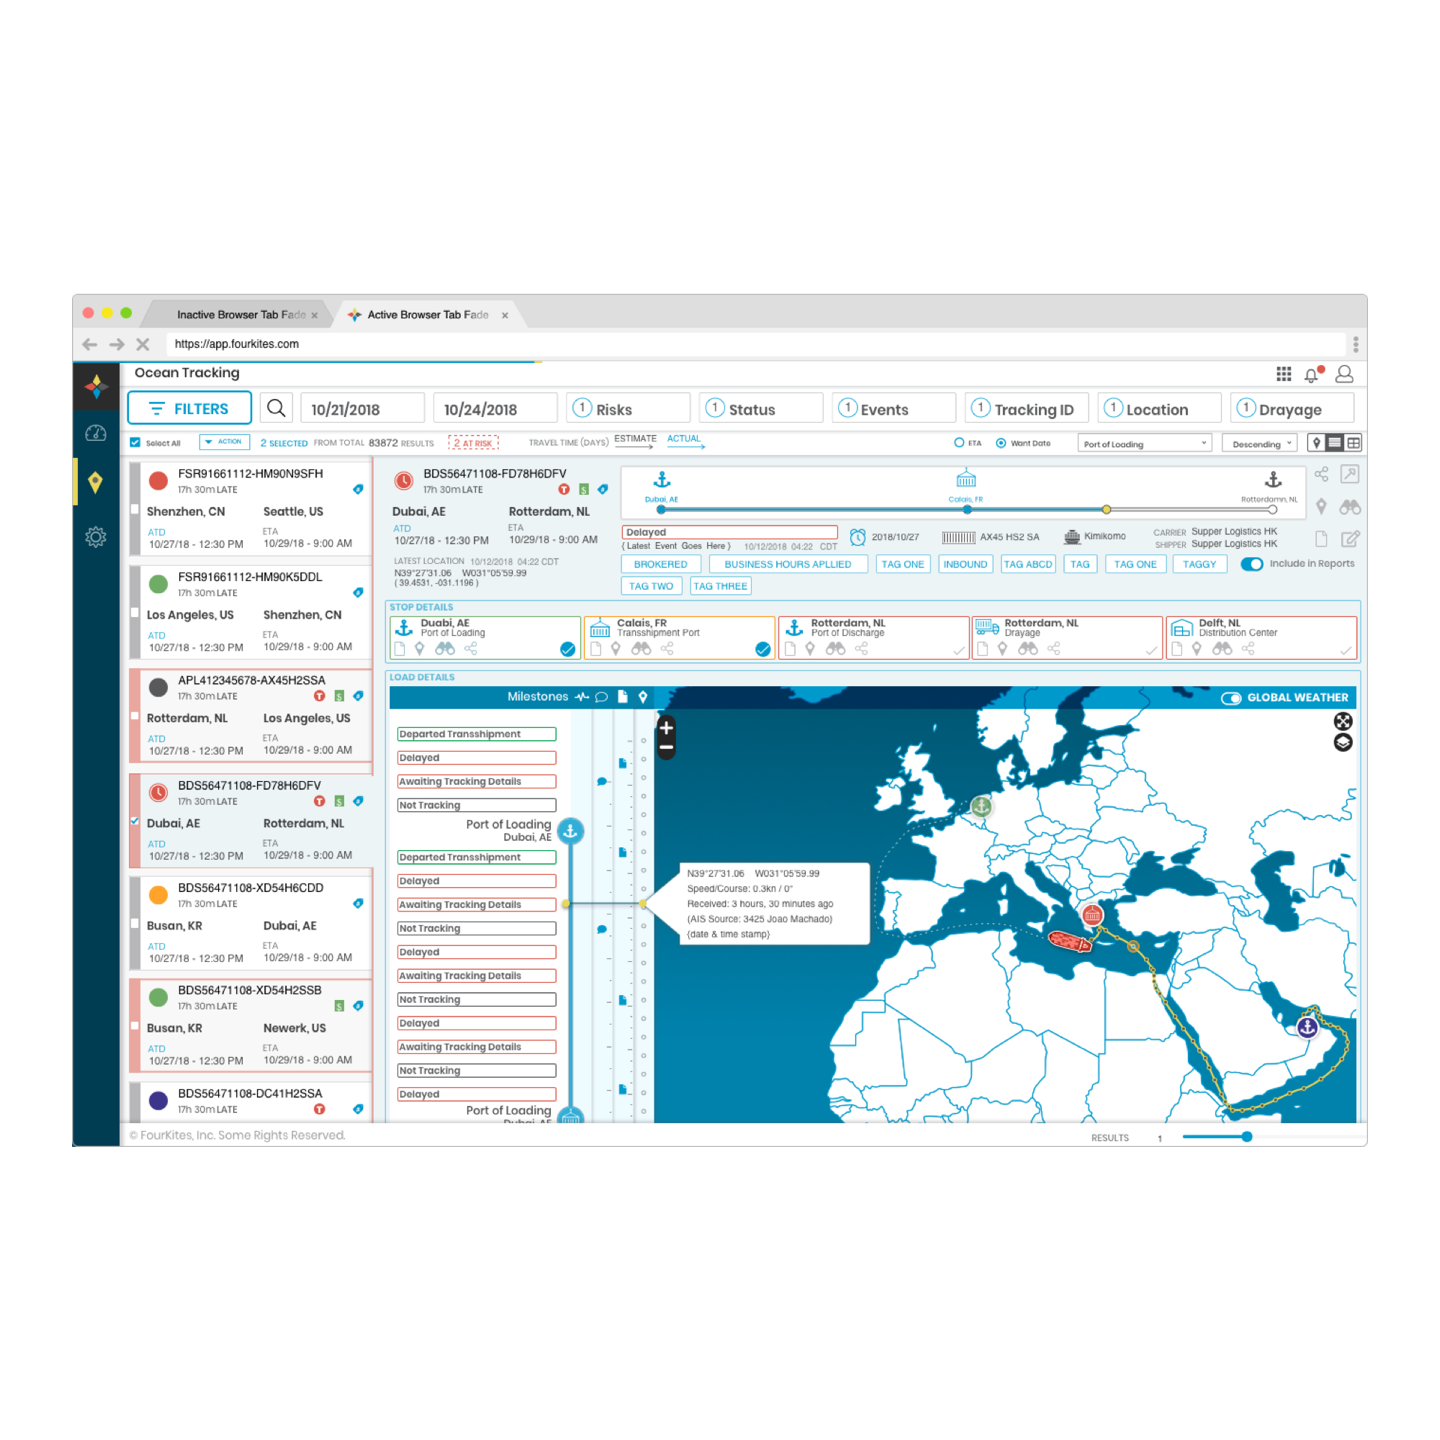
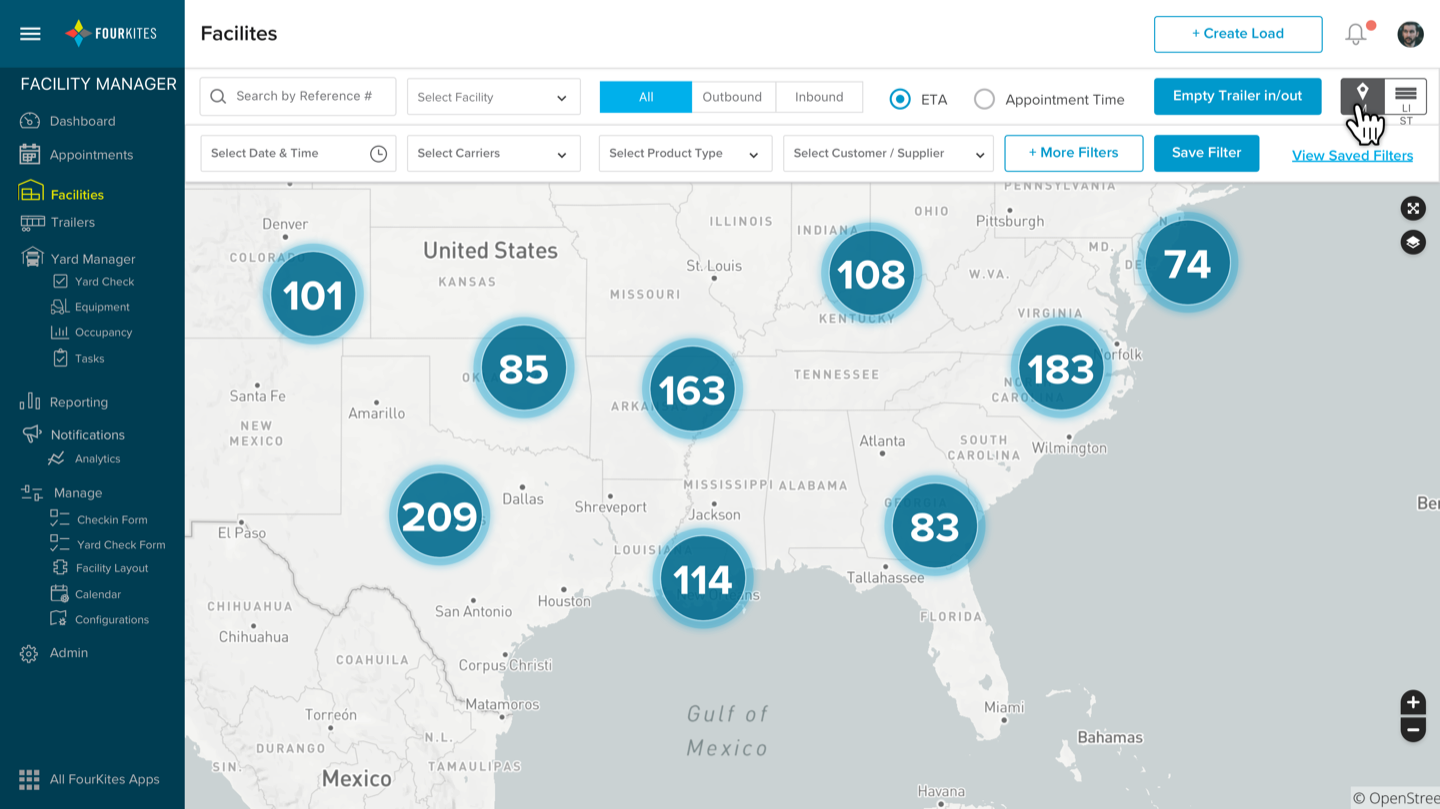
Designed the flagship visibility platform showing shipment status, confidence levels, and predicted exceptions. Users could drill into any data point to understand sources and reliability.
- HIGH Show the ETA, solid Act on it
- MEDIUM ETA + a confidence band Plan, but keep watching
- LOW Flag it · prompt "verify" Confirm before you bet
- CONFLICTING Anomaly alert · escalate Something's off, investigate
Never one confident number. The platform you believe at 2am is the one that admits what it doesn't know.
Predictive Analytics Dashboard
Built interfaces that surfaced delays 6–12 hours before traditional ETAs, turning logistics managers from firefighters into planners.
Alert System Redesign
Transformed alerts from "something happened" to "here's what happened, why, and what you should do about it."
What It Took to Land It
Inside the building, almost everyone wanted the single confident number: sales could demo it, engineering could ship it faster, leadership liked how sure it looked. Showing uncertainty was the harder sell internally before it was ever a design problem.
The case that turned it was reefer. A refrigerated trailer's temperature never reads as a steady line: doors open, the truck rolls into the sun, the unit cycles on and off, and thermodynamics does the rest; at load or unload a gauge near the door can drop out of range for a minute. A flat, confident line would have been a lie, and every operator knew it. So we showed the real jagged curve (multiple gauges, out-of-range moments and all) and it matched what customers already saw on the dock. That's exactly why they trusted it.
That radical honesty became the template for the rest: ETAs shown with their confidence, and even the business truths software usually flattens, like a truck arriving too early being a penalty, not a win. The proof did the persuading. The trade was a UI you had to explain instead of one clean number, and it was worth it.
Results
- Customer retention up 38% YoY
- Predictive analytics surfaced issues 6–12 hours earlier than traditional ETAs
- Enabled a real-time control tower trusted by 30+ Fortune 500 enterprises
- Became the layer customers chose to grow on, driving repeated account expansion
That's a 38% relative improvement in retention year-over-year, not 38 percentage points. I owned the confidence-level design that made the data trustworthy enough to act on; retention is a company-wide outcome it contributed to, not one I claim solo.
What This Unlocked
The real outcome was proving that transparency about uncertainty builds more trust than false confidence.
Gallery
LET'S TALK
Interested in discussing enterprise design challenges or exploring opportunities?